
At one glance, see how the retail and office markets have been performing in Singapore.
Tables are updated every quarter when the relevant government agency releases official results.
Office market key indicators
Prices of office space increased by 1.9% in 2nd Quarter 2018, compared with the 1.3% increase in the previous quarter. Rentals of office space increased by 1.6% in 2nd Quarter 2018, compared with the 2.6% increase in the previous quarter.
| Key indicators | Change | 1Q2018 | 2Q2018 |
| Price index | +1.9% | 133.1 | 135.6 |
| Rental index | +1.6% | 167.6 | 170.3 |
| Pipeline supply | -8.3% | 791,000 sqm GFA | 725,000 sqm GFA |
| Vacancy rate | -0.3% point | 12.5% | 12.2% |
Median rentals and vacancy of office space
| Quarter | Median rentals (S$psf pm) based on lease commencement | Median rentals (S$psf pm) based on contract date | Vacancy rate (%) | |||
| Cat 1 | Cat 2 | Cat 1 | Cat 2 | Cat 1 | Cat 2 | |
| 3Q/2014 | 10.32 | 6.17 | 10.32 | 6.13 | 7.5 | 8.7 |
| 4Q/2014 | 10.58 | 6.27 | 10.59 | 6.23 | 9.8 | 10.4 |
| 1Q/2015 | 10.62 | 6.31 | 10.63 | 6.29 | 11.2 | 9.9 |
| 2Q/2015 | 10.31 | 6.15 | 10.33 | 6.13 | 10.2 | 9.7 |
| 3Q/2015 | 10.04 | 5.96 | 10.05 | 5.95 | 8.9 | 9.8 |
| 4Q/2015 | 9.86 | 5.86 | 9.86 | 5.85 | 9.3 | 9.6 |
| 1Q/2016 | 9.52 | 5.80 | 9.50 | 5.74 | 8.6 | 9.4 |
| 2Q/2016 | 9.21 | 5.59 | 9.20 | 5.54 | 8.3 | 9.4 |
| 3Q/2016 | 9.00 | 5.53 | 9.00 | 5.48 | 11.0 | 10.2 |
| 4Q/2016 | 8.81 | 5.43 | 8.80 | 5.39 | 12.6 | 10.6 |
| 1Q/2017 | 8.65 | 5.22 | 8.65 | 5.18 | 11.8 | 11.5 |
| 2Q/2017 | 8.50 | 5.16 | 8.50 | 5.13 | 14.2 | 11.7 |
| 3Q/2017 | 8.75 | 5.28 | 8.75 | 5.25 | 17.7 | 11.5 |
| 4Q/2017 | 9.00 | 5.41 | 9.00 | 5.38 | 15.7 | 11.2 |
| 1Q/2018 | 9.23 | 5.55 | 9.22 | 5.51 | 14.5 | 11.7 |
| 2Q/2018 | 9.45 | 5.63 | 9.44 | 5.58 | 14.3 | 11.3 |
Refers to office space in buildings located in core business areas in Downtown Core and Orchard Planning Area
which are relatively modern or recently refurbished, command relatively high rentals and have large floor plate size
and gross floor area.
Refers to the remaining office space in Singapore which are not included in “Category 1”.

Pipeline supply of office space
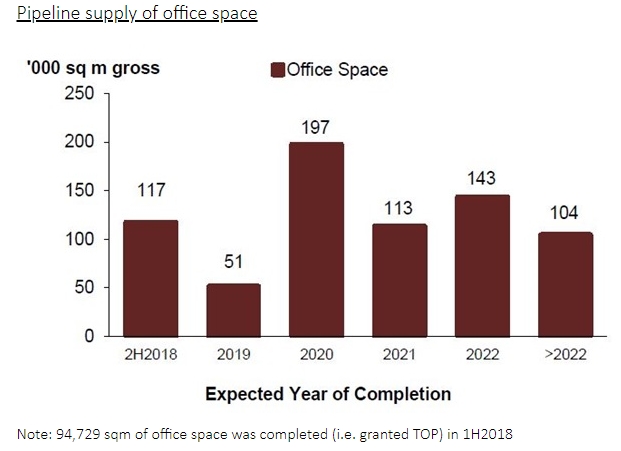
As at the end of 2nd Quarter 2018, there was a total supply of about 725,000 sq m GFA of office space in the pipeline, compared with the 791,000 sq m GFA of office space in the pipeline in the previous quarter
Stock and vacancy of office space
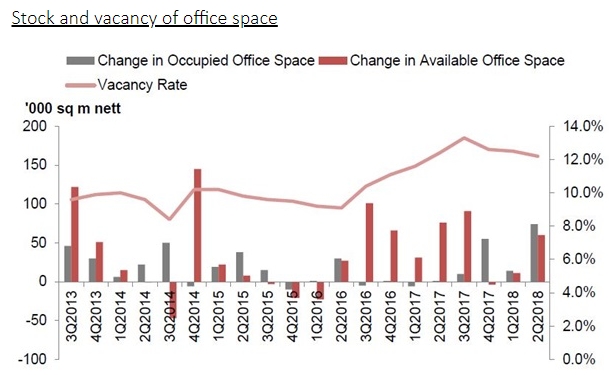
The amount of occupied office space increased by 74,000 sq m (nett) in 2nd Quarter 2018, compared with the increase of 14,000 sq m (nett) in the previous quarter. The stock of office space increased by 60,000 sq m (nett) in 2nd Quarter 2018, compared with the increase of 11,000 sq m (nett) in the previous quarter. As a result, the island-wide vacancy rate of office space dropped to 12.2% at the end of 2nd Quarter 2018, from 12.5% at the end of the previous quarter
Retail market key indicators
| Key indicators | Change | 1Q2018 | 2Q2018 |
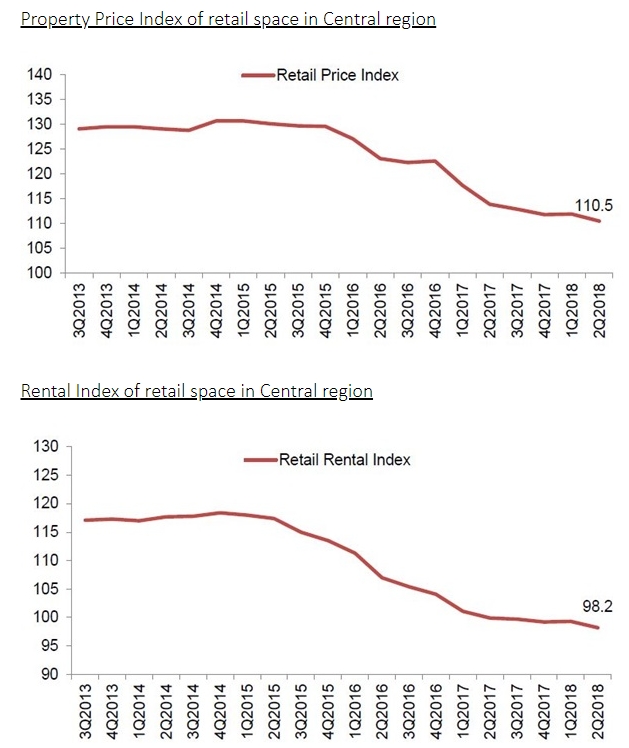
| Price index | -1.3% | 111.9 | 110.5 |
| Rental index | -1.1% | 99.3 | 98.2 |
| Pipeline supply | -6.0% | 530,000 sqm GFA | 498,000 sqm GFA |
| Vacancy rate | -0.2% point | 7.5% | 7.3% |
Median rentals and vacancy of retail space
| Quarter | Median rentals (S$psf pm) based on lease commencement | Median rentals (S$psf pm) based on contract date | Vacancy rate (%) | ||||||
| Central Area | Central Area | Central Area | |||||||
| OR | Outside OR | OCA | OR | Outside OR | OCA | OR | Outside OR | OCA | |
| 3Q/2014 | 10.85 | 6.43 | 6.66 | 10.88 | 6.68 | 6.04 | 7.9 | 7.4 | 5. |
| 4Q/2014 | 10.93 | 6.49 | 6.67 | 10.96 | 6.75 | 6.05 | 5.6 | 7.0 | 5.3 |
| 1Q/2015 | 10.86 | 6.47 | 6.66 | 10.89 | 6.72 | 6.04 | 7.2 | 9.6 | 5.4 |
| 2Q/2015 | 10.81 | 6.42 | 6.64 | 10.85 | 6.67 | 6.02 | 7.9 | 10.3 | 5.6 |
| 3Q/2015 | 10.75 | 6.30 | 6.50 | 10.75 | 6.53 | 5.90 | 7.9 | 10.2 | 5.4 |
| 4Q/2015 | 10.56 | 6.19 | 6.48 | 10.56 | 6.42 | 5.88 | 7.6 | 9.5 | 6.1 |
| 1Q/2016 | 10.40 | 6.05 | 6.39 | 10.40 | 6.27 | 5.80 | 8.8 | 8.9 | 6.4 |
| 2Q/2016 | 10.00 | 5.79 | 6.19 | 10.05 | 6.00 | 5.62 | 9.2 | 9.3 | 6.8 |
| 3Q/2016 | 9.82 | 5.69 | 6.14 | 9.88 | 5.89 | 5.5 | 8.0 | 11.3 | 7.3 |
| 4Q/2016 | 9.80 | 5.63 | 6.05 | 9.87 | 5.81 | 5.50 | 6.8 | 8.5 | 7.2 |
| 1Q/2017 | 9.76 | 5.47 | 5.83 | 9.85 | 5.65 | 5.30 | 7.6 | 8.8 | 7.3 |
| 2Q/2017 | 9.64 | 5.39 | 5.78 | 9.73 | 5.57 | 5.25 | 7.7 | 9,3 | 7.6 |
| 3Q/2017 | 9.74 | 5.42 | 5.65 | 9.80 | 5.61 | 5.14 | 7.4 | 9.2 | 7.9 |
| 4Q/2017 | 9.74 | 5.37 | 5.66 | 9.80 | 5.56 | 5.15 | 6.0 | 8.2 | 7.3 |
| 1Q/2018 | 9.79 | 5.38 | 5.66 | 9.85 | 5.56 | 5.16 | 6.1 | 8.2 | 7.5 |
| 2Q/2018 | 9.77 | 5.31 | 5.59 | 9.85 | 5.50 | 5.09 | 6.0 | 8.4 | 7.2 |
Refers to the Orchard Planning Area.
The Map of Central Region showing Orchard and Central Area outside Orchard is available at:
https://spring.ura.gov.sg/lad/ore/login/map_city_area.pdf.
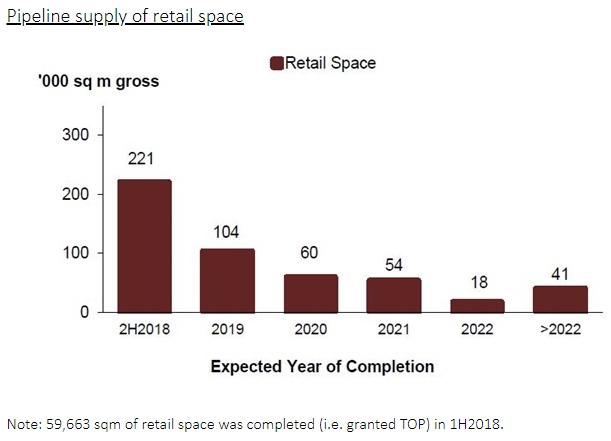
Pipeline supply of retail space
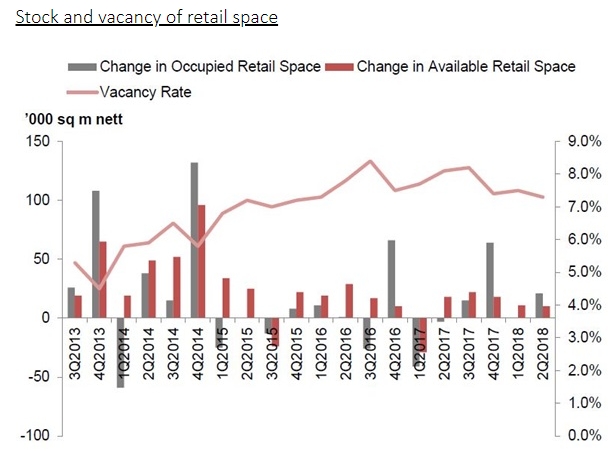
As at the end of 2nd Quarter 2018, there was a total supply of 498,000 sq m GFA of retail space from projects in the pipeline, compared with the 530,000 sq m GFA of retail space in the pipeline in the previous quarter.
Stock and vacancy of retail space
The amount of occupied retail space increased by 21,000 sq m (nett) in 2nd Quarter 2018, after remaining unchanged in the previous quarter. The stock of retail space increased by 10,000 sq m (nett) in 2nd Quarter 2018, compared with the increase of 11,000 sq m (nett) in the previous quarter. As a result, the island-wide vacancy rate of retail space decreased to 7.3% at the end of 2nd Quarter 2018, from 7.5% at the end of the previous quarter.